Tag Archives: law

Just because it’s lost doesn’t mean it can’t be stolen

When normal people find something left behind, in a place of business (like a bar), that someone will likely want to have back (like an iPhone), they leave it with someone who works there (like the bartender). Then, the person who left it behind has a way to check if anyone has returned it. Taking it is stealing.

Gizmodo probably suspected that the prototype iPhone they bought was stolen. By now, they’ve made back the purchase price in page views, with a healthy return on top to help cover legal fees.

And if you think any of this will hurt the new iPhone’s sales, I have a bridg^H^H^H^H^Hphone to sell you.

Hacking the Constitution

A vote for the President of the United States is actually a vote for an “elector” who pledges, but is not legally obligated, to vote for a specific candidate in the Electoral College. Forty-eight states then allocate all of their electoral votes to the popular vote winner in that state. This means that a candidate receiving the most votes nationwide is not necessarily the one that receives the most electoral votes and becomes President. If the popular-vote loser many states by small margins, and loses some of the others by large margins, they can win the electoral vote, despite losing the national popular vote.

This winner-takes-all system of allocating electoral votes also has the side effect of making a few “battleground” states the primary focus of election campaigns. Candidates descend on these states, funneling money and advertising into them, and tailoring their campaigns to win over voters there. Voters, of either party, in the remaining “spectator” states are effectively disenfranchised, and the small percentage of voters in the battleground states elect the president.

This isn’t even how the electoral college was intended to work. The framers intended that the electoral college would usually fail to choose a clear winner, instead nominating the most popular candidates for election by Congress. This hasn’t happened in over two hundred years.

Programmers have a term for something that’s neither operating as originally intended nor guaranteed to do what their users ask it to do. The Constitution is buggy.

Yet the Constitution is notoriously hard to change. A programmer might use the term legacy.

How would a programmer fix this? Find a way to hack1 a bug fix into the legacy system.

What should the goal of the fix be? We should elect the president in the same way that every governor, mayor, senator, representative, city council member and dog-catcher2 is; by popular vote. If popular vote is good enough for every single other elected office in this country and in many other democratic countries around the world, it should be good enough for the President of the United States of America.

How do we change the Constitution? Turns out we don’t have to. The founders left the allocation of electoral votes up to the states:

Each State shall appoint, in such Manner as the Legislature thereof may direct, a Number of Electors…
-U.S. Constitution

The appointment, and mode of appointment, of electors belong exclusively to the states
-U.S. Supreme Court

And the fix? The National Popular Vote Plan allocates all of a state’s electoral votes to the national popular vote winner. It only goes into effect once enough states pass it to command a majority of electoral votes. The electoral college won’t go away, but it will become obsolete. In programming terms, this plan ensures a buggy legacy system will never (again) get fed the kind of data that triggers the bug.

The National Popular Vote plan has been making its way through state legislatures for the last few years. I’ve brought it up in conversation a few times recently (because of my Visualizing the National Popular Vote plan project), and I’m surprised how many people don’t know about it. There should be a huge grass-roots movement behind this plan to re-enfranchise the electorate, but even smart, well-informed, thinking people haven’t heard of it. So please, if you agree with me and think the National Popular Vote Plan is a good idea, forward this page or NPV’s website to your friends, bring it up at parties, or support it with a donation. And if you don’t agree with me, forward this page or NPV’s website to your friends, bring it up at parties, or… well I guess I can’t expect you to support it with a donation.

Let’s get rid of this obsolete, broken, idiotic electoral college system once and for all.

  1. Note to non-technical readers: Among programmers, hack generally means a quick, clever, “outside-of-the-box” solution to a difficult or intractable problem. That is the sense in which I am using the term hack here. If you think the National Popular Vote plan is about subverting or circumventing the constitution, you have misunderstood it. []
  2. My thanks to Hendrik Hertzberg, National Popular Vote’s bulldog, in whose writings in the New Yorker I first heard about this clever plan. I believe the inclusion of dog-catcher in this list is due to him but I cannot find the exact quote. []

Visualizing the National Popular Vote plan

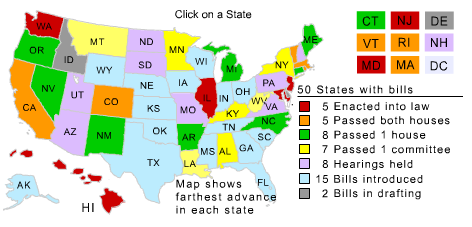
This graphic visualizes the progress of the National Popular Vote plan (more about the politics of this plan in Hacking the Constitution).

The existing visualization on National Popular Vote’s website was flawed enough to inspire this attempt at fixing it. They use a national map with states colored according to the plan’s progress. Using geographical visualization conflicts with the plan’s intention to make the states as entities less influential, and with the plan’s success depending on the number of electoral votes, not the geographical size or population of the states1. And even though the steps in passing the plan suggest a spectrum, the colors are seemingly random.

Plus NPV is a good cause that deserves more attention. And as a vocal Flash critic, I should put my money where my mouth is and implement a cross-browser, scalable, interactive, vector graphic to show that it can be done without Flash.

Visualizing complex data well is challenging, and this is no exception. The plan will likely be adopted slowly over many years, so the graphic must be designed to expand. The technology must also be future-proof; I don’t want to have to re-implement the graphic, convert it to a different format, or get access to future versions of software, or the operating systems that software must run on, just to keep supporting it. This pretty much rules out Flash and Sliverlight.

These constraints make SVG2 and JavaScript a good choice. SVG support is still nascent in Gecko and WebKit3 (and even Opera supports it), but the standard is pretty usable and I expect it to gain more adoption over time. All of the rendering code is in JavaScript. I’d put money on JavaScript interpreters remaining readily available ten years from now. I unfortunately have no ability (or desire, for that matter) to test this in IE with Adobe’s SVG plugin; if you try it, email me the results.

There are many different entities involved in the process: fifty states, each with two legislative bodies and a governor, and a total of 538 electoral votes; and many different events: passing the first body of a legislature, passing the second, bills passing the same body subsequent times, being signed into law, being vetoed, vetoes being overridden, and (hopefully never) laws being repealed.

The data comes from disparate sources; most comes from NPV’s website, but I had to search for the vetoes. The data is not just linear; it overlaps and interacts. A veto affects two of the charts but not the third, and a repeal would affect all three. The three charts have an order; a bill cannot pass both houses before it passes one, and cannot be signed into law before it passes both.

To include all this data, a visualization would either have to be interactive or poster-sized. This one is interactive; you can mouse over vertexes in the charts and get more information about the events they represent. You can quickly and easily find out:

  • The exact progress of NPV at any time since its introduction.
  • Who, what and where for any NPV-related event.
  • All NPV-related events that have occurred in any particular state.
  • How significant each state’s contribution to the electoral vote tally has been.
  • Firsts, lasts, largests and smallests.

As with many real-world data visualizations, unexpected patterns emerge. Most activity is clustered in the winter, spring and early summer, when legislative bodies are in session. The only things that happen between August and December are vetoes. This cycle will likely become much more obvious once the graphic spans a few more years.

Hawaii’s legislature overrode their governor’s second veto, and The Governator has twice robbed the plan of California’s 55 electoral votes. Neither of these facts is obvious from the current graphic. If the plan is ever repealed, the graphic would need to show that too.

As I said in Hacking the Constitution, the the National Popular Vote plan deserves a lot more attention and support, so forward this page or NPV’s website to your friends, bring it up at parties, support it with a donation, or include the graphic on your web page.

  1. If a geographical design were used on a visualization of the progress of this plan, it should at least be a cartogram. []
  2. The HTML <canvas> element might also have been a viable option, but I already knew SVG. []
  3. For a good time, try resizing the font in Safari 3. []